Five facts about the global container traffic.
1.- (Almost) constant growth:
Container traffic has always been an indicator known for its reliability and predictive anticipation of global, regional and even national economic growth. It is the end result of a country’s commercial activity, whether it is receiving goods (imports) of all kinds for domestic consumption and production, or selling locally-produced goods (exports) to the world. The sum of both is obviously positively and directly correlated with the number of containers that that country has handled.
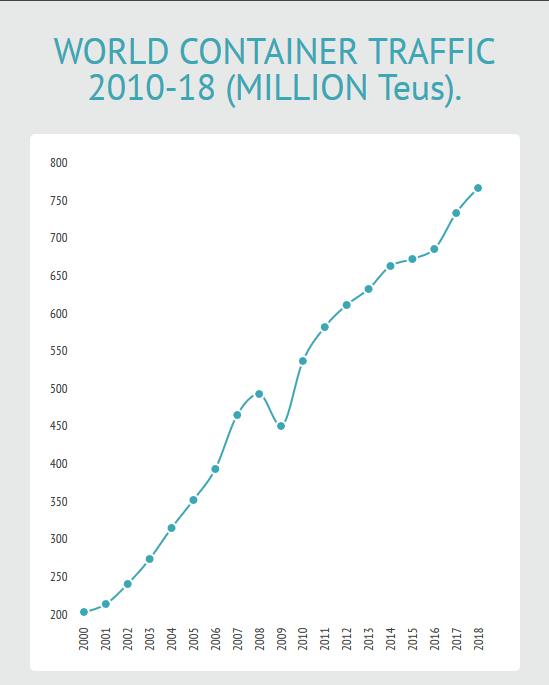
This magnitude is measured in TEUs: “Twenty Equivalent Units” such that a 20-foot container is one TEU and a 40-foot container is two TEUs. In the year 2000 there was a worldwide container traffic equivalent to 214 Million TEUs, while in 2018, the most recent year with consolidated data, this figure rose to 777 Million, which represents a growth of 263%. A constant year-on-year average growth of 8%, only interrupted in 2009 due to commercial tensions caused by the slowdown in the world economy that began with the subprime.
2.- The Chinese Hegemony:
The enormous importance of China as the engine of the world economy is reflected in an obvious way in the proportion of containers that enter China (since it imports huge quantities of raw materials) or leaves (China exports practically every kind of thing to the rest of the World).
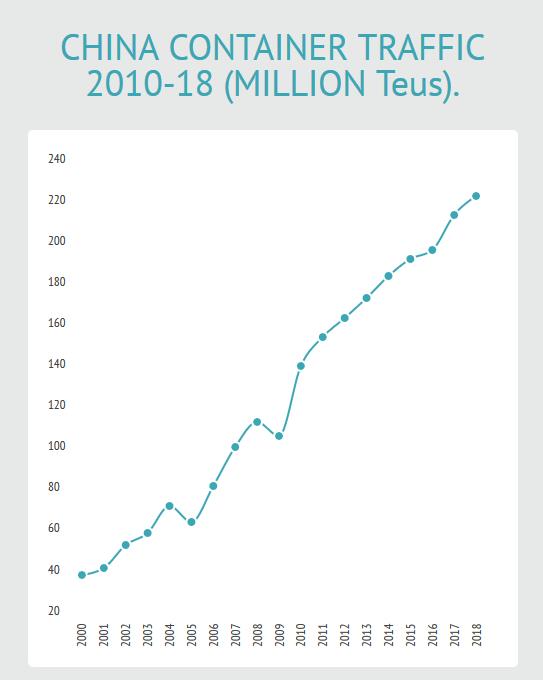
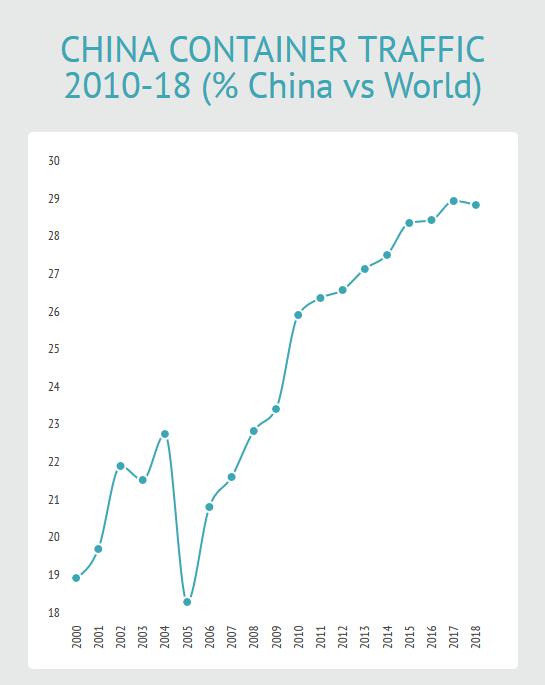
Thus, the growth we analysed in the previous point is even more pronounced in the particular case of China. In 2010, China handled 44 million TEUs while that figure almost quintupled in 2018 to 226 million TEUs. The relative importance is also growing so that while in 2010 China represented 19% of global traffic in 2010, it surpassed 25% to stand in 2018 at 29%.
3.- The Domination of Asia and Decline of America and the EU:
f the 10 main actors (who control 60% of the world’s container traffic), 7 are Asian countries (only the United States, Germany and Spain are not). China, Singapore, Korea and Japan are included in the top 5.
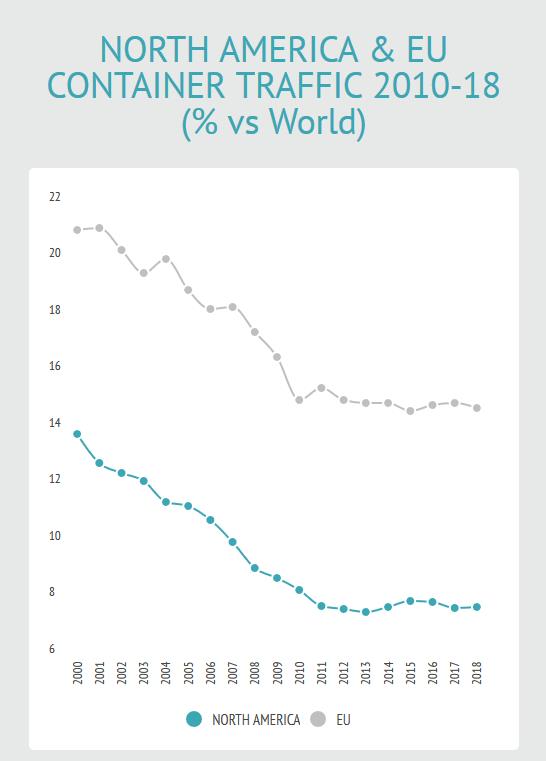
In continental terms, in 2018, the Asia Pacific region represented 55% of total global traffic, well ahead of 12% of the Eurozone (15% for the EU) or 8% of traffic generated in North America. In addition, the trends are the opposite to those recorded in Asia since both America and Europe contribute less and less in absolute terms to global traffic: since 2000 both North America and the European Union have each lost 6% of global traffic in absolute terms.
4.- The Situation in Europe:
Europe has, according to data from 2018, 2 countries within the first 10, namely, and in the following order, Germany (#8), Spain (#10), and 5 more within the first 25, The Netherlands (#11), Italy (#12), Belgium (#13), United Kingdom (#14) and France (#25). These 7 countries represent 12% of global container traffic.
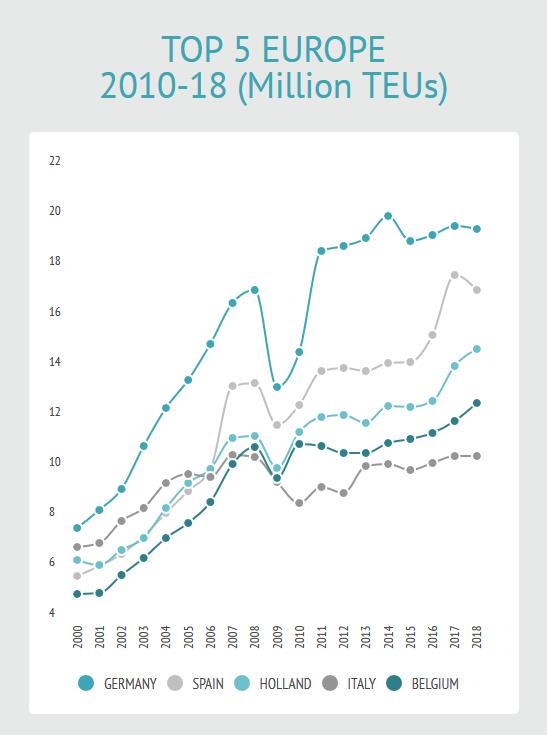
Much further back we find other European countries such as Malta, Portugal, Russia, Finland and Sweden.
5.- The case of Spain:
Spain, consistently in the top 10 in the last two decades, is a particularly positive case, not only compared to its neighbours and closest partners (above powers such as the Netherlands, France, Italy and the United Kingdom), but it also performs better in both relative and absolute terms.
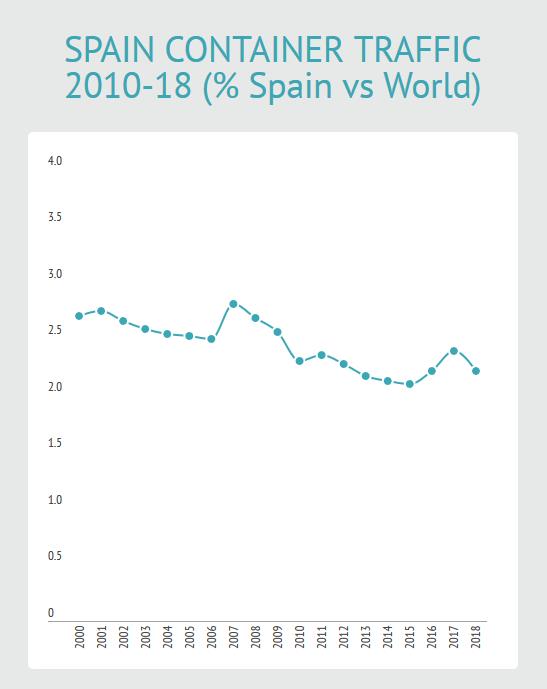
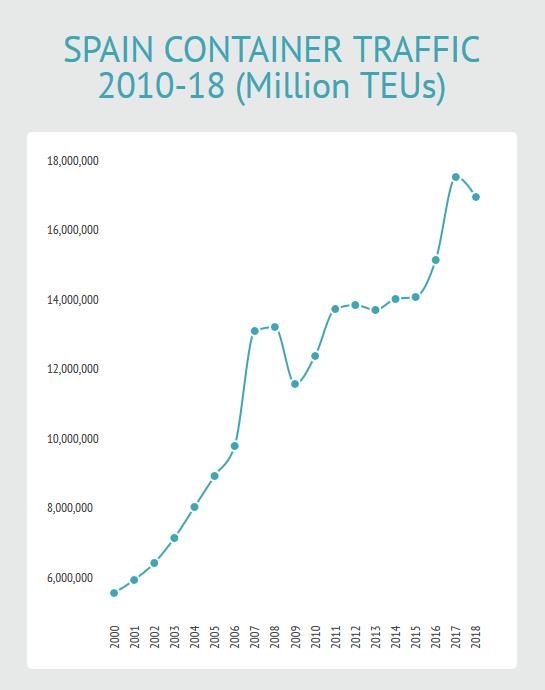
In 2000, Spain managed 5.8 Million TEUs, having already exceeded 10 Million in 2010, before, in 2018, achieving a figure above 17 Million. Similarly, in 2000 Spain represented 2.7% of world traffic, before falling to 2.2% in 2018. In this period Spain has overtaken Italy, the United Kingdom and the Netherlands (3 European Countries) but it has been surpassed by Malaysia, Hong Kong and the United Arab Emirates. (3